Workflow
The workflow and application usecases are demonstrated using source code from the boost/interprocess library. Boost versions 1.52 and 1.54 are used and refered below as the 'previous' version and the 'current' version accordingly.
Collect data
The first step is to collect the data. The 'collect' tool has got multiple options to enable various metrics plugins. Let's collect the number of lines of code and cyclomatic complexity metrics for the previous (1.52.0 version) boost interprocess library. Assuming that 2 versions of boost library are unpacked in the current working directory:
> cd boost_1_52_0
> python "/path/to/metrix++.py" collect --std.code.lines.code --std.code.complexity.cyclomatic -- boost/interprocess
> cd ../ # return back to working directory
The list of arguments after '--' enumerates the paths to read the source files. As a result of execution of this command, a file metrixpp.db will be written in the current working directory. It can be redefined using the --db-file option.
Metrix++ can compare code bases which reduces processing scope to the modified or new code. So, let's collect the same data for the current (1.54.0 version) boost interprocess library.
> cd boost_1_54_0
> python "/path/to/metrix++.py" collect --std.code.lines.code --std.code.complexity.cyclomatic -- boost/interprocess --db-file-prev=../boost_1_52_0/metrixpp.db
> cd ../ # return back to working directory
The option --db-file-prev points to the file with the data collected in the previous step. So, eventually it executed iterative collection. It can speed up the exectuion significantly, depending on amount of changes between two version.
Check other options of the collect tool by executing:
> python "/path/to/metrix++.py" collect --help
View data
Summary metrics and distribution tables/graphs
It is time to look at the data files collected (step above). The command:
> python "/path/to/metrix++.py" view --db-file=boost_1_54_0/metrixpp.db
prints summary metrics, like minimum/maximum, and distribution/frequency tables:
:: info: Overall metrics for 'std.code.complexity:cyclomatic' metric
	Average        : 0.652902698283
	Minimum        : 0
	Maximum        : 37
	Total          : 1597.0
	Distribution   : 2446 regions in total (including 0 suppressed)
	  Metric value : Ratio : R-sum : Number of regions
	             0 : 0.771 : 0.771 : 1886	|||||||||||||||||||||||||||||||||||||||||||||||||||||||||||||||||||||||||||||
	             1 : 0.110 : 0.881 :  268	|||||||||||
	             2 : 0.044 : 0.925 :  108	||||
	             3 : 0.025 : 0.949 :   60	||
	             4 : 0.016 : 0.966 :   40	||
	             5 : 0.007 : 0.973 :   18	|
	             6 : 0.006 : 0.979 :   14	|
	             7 : 0.004 : 0.983 :   10
	             8 : 0.003 : 0.986 :    8
	             9 : 0.002 : 0.988 :    4
	            10 : 0.004 : 0.991 :    9
	            11 : 0.002 : 0.993 :    4
	            12 : 0.001 : 0.994 :    3
	            13 : 0.001 : 0.995 :    2
	            14 : 0.001 : 0.996 :    2
	         15-16 : 0.001 : 0.997 :    3
	         17-18 : 0.001 : 0.998 :    3
	            20 : 0.000 : 0.999 :    1
	         23-25 : 0.001 : 1.000 :    2
	            37 : 0.000 : 1.000 :    1

:: info: Overall metrics for 'std.code.lines:code' metric
	Average        : 6.64356984479
	Minimum        : 0
	Maximum        : 201
	Total          : 23970.0
	Distribution   : 3608 regions in total (including 0 suppressed)
	  Metric value : Ratio : R-sum : Number of regions
	           0-1 : 0.088 : 0.088 :  319	|||||||||
	             2 : 0.320 : 0.409 : 1155	||||||||||||||||||||||||||||||||
	             3 : 0.108 : 0.517 :  390	|||||||||||
	             4 : 0.081 : 0.598 :  294	||||||||
	             5 : 0.080 : 0.678 :  290	||||||||
	             6 : 0.061 : 0.739 :  220	||||||
	             7 : 0.049 : 0.788 :  176	|||||
	             8 : 0.030 : 0.818 :  109	|||
	             9 : 0.025 : 0.843 :   89	||
	         10-11 : 0.032 : 0.876 :  117	|||
	         12-13 : 0.020 : 0.895 :   71	||
	            14 : 0.012 : 0.907 :   43	|
	         15-16 : 0.017 : 0.924 :   61	||
	         17-19 : 0.015 : 0.939 :   55	||
	         20-22 : 0.013 : 0.952 :   46	|
	         23-26 : 0.011 : 0.963 :   40	|
	         27-30 : 0.009 : 0.972 :   33	|
	         31-39 : 0.009 : 0.981 :   33	|
	         40-65 : 0.009 : 0.991 :   34	|
	        66-201 : 0.009 : 1.000 :   33	|

:: info: Directory content:
	Directory      : .
The same command with --db-file-prev option enables comparision and change trends are shown in [] brackets:
> python "/path/to/metrix++.py" view --db-file=boost_1_54_0/metrixpp.db --db-file-prev=boost_1_52_0/metrixpp.db
:: info: Overall metrics for 'std.code.complexity:cyclomatic' metric
	Average        : 0.652902698283 [+0.00362138411453]
	Minimum        : 0 [+0]
	Maximum        : 37 [+1]
	Total          : 1597.0 [+16.0]
	Distribution   : 2446 [+11] regions in total (including 0 [+0] suppressed)
	  Metric value : Ratio : R-sum : Number of regions
	             0 : 0.771 : 0.771 : 1886 [+5   ]	|||||||||||||||||||||||||||||||||||||||||||||||||||||||||||||||||||||||||||||
	             1 : 0.110 : 0.881 :  268 [+4   ]	|||||||||||
	             2 : 0.044 : 0.925 :  108 [+0   ]	||||
	             3 : 0.025 : 0.949 :   60 [+2   ]	||
	             4 : 0.016 : 0.966 :   40 [-1   ]	||
	             5 : 0.007 : 0.973 :   18 [-1   ]	|
	             6 : 0.006 : 0.979 :   14 [+1   ]	|
	             7 : 0.004 : 0.983 :   10 [+1   ]
	             8 : 0.003 : 0.986 :    8 [+1   ]
	             9 : 0.002 : 0.988 :    4 [+0   ]
	            10 : 0.004 : 0.991 :    9 [-2   ]
	            11 : 0.002 : 0.993 :    4 [+1   ]
	            12 : 0.001 : 0.994 :    3 [+0   ]
	            13 : 0.001 : 0.995 :    2 [+0   ]
	            14 : 0.001 : 0.996 :    2 [+0   ]
	         15-16 : 0.001 : 0.997 :    3 [-1   ]
	         17-18 : 0.001 : 0.998 :    3 [+1   ]
	            20 : 0.000 : 0.999 :    1 [+0   ]
	         23-25 : 0.001 : 1.000 :    2 [+0   ]
	         36-37 : 0.000 : 1.000 :    1 [+0   ]

:: info: Overall metrics for 'std.code.lines:code' metric
	Average        : 6.64356984479 [+0.012181964309]
	Minimum        : 0 [+0]
	Maximum        : 201 [+4]
	Total          : 23970.0 [+223.0]
	Distribution   : 3608 [+27] regions in total (including 0 [+0] suppressed)
	  Metric value : Ratio : R-sum : Number of regions
	           0-1 : 0.088 : 0.088 :  319 [+3   ]	|||||||||
	             2 : 0.320 : 0.409 : 1155 [+9   ]	||||||||||||||||||||||||||||||||
	             3 : 0.108 : 0.517 :  390 [-3   ]	|||||||||||
	             4 : 0.081 : 0.598 :  294 [+7   ]	||||||||
	             5 : 0.080 : 0.678 :  290 [+7   ]	||||||||
	             6 : 0.061 : 0.739 :  220 [-1   ]	||||||
	             7 : 0.049 : 0.788 :  176 [-2   ]	|||||
	             8 : 0.030 : 0.818 :  109 [-1   ]	|||
	             9 : 0.025 : 0.843 :   89 [+4   ]	||
	         10-11 : 0.032 : 0.876 :  117 [+9   ]	|||
	         12-13 : 0.020 : 0.895 :   71 [-9   ]	||
	            14 : 0.012 : 0.907 :   43 [+0   ]	|
	         15-16 : 0.017 : 0.924 :   61 [+0   ]	||
	         17-19 : 0.015 : 0.939 :   55 [+6   ]	||
	         20-22 : 0.013 : 0.952 :   46 [-3   ]	|
	         23-26 : 0.011 : 0.963 :   40 [+2   ]	|
	         27-30 : 0.009 : 0.972 :   33 [-3   ]	|
	         31-39 : 0.009 : 0.981 :   33 [+0   ]	|
	         40-65 : 0.009 : 0.991 :   34 [+1   ]	|
	        66-201 : 0.009 : 1.000 :   33 [+1   ]	|

:: info: Directory content:
	Directory      : .
Reducing analysis scope
There are two ways to reduce the analysis scope for the view tool. The first is to enumerate paths of interest. For example, the following command reduces scope to the 'allocators' sub-directory within the processed code.
> python "/path/to/metrix++.py" view --db-file=boost_1_54_0/metrixpp.db -- ./boost/interprocess/allocators
The second is to specify the --scope-mode option, which instructs the tool to process only modified and/or new files/regions. For example, to view the summary metrics for all modified and new regions:
> python "/path/to/metrix++.py" view --db-file=boost_1_54_0/metrixpp.db --db-file-prev=boost_1_52_0/metrixpp.db --scope-mode=touched
:: info: Overall metrics for 'std.code.complexity:cyclomatic' metric
	Average        : 1.84924623116 [-0.0230941943761]
	Minimum        : 0 [+0]
	Maximum        : 37 [+1]
	Total          : 368.0 [+16.0]
	Distribution   : 199 [+11] regions in total (including 0 [+0] suppressed)
	  Metric value : Ratio : R-sum : Number of regions
	             0 : 0.608 : 0.608 : 121 [+5  ]	|||||||||||||||||||||||||||||||||||||||||||||||||||||||||||||
	             1 : 0.131 : 0.739 :  26 [+4  ]	|||||||||||||
	             2 : 0.070 : 0.809 :  14 [+0  ]	|||||||
	             3 : 0.060 : 0.869 :  12 [+2  ]	||||||
	             4 : 0.015 : 0.884 :   3 [-1  ]	||
	             5 : 0.015 : 0.899 :   3 [-1  ]	||
	             6 : 0.005 : 0.905 :   1 [+1  ]	|
	             7 : 0.015 : 0.920 :   3 [+1  ]	||
	             8 : 0.015 : 0.935 :   3 [+1  ]	||
	             9 : 0.010 : 0.945 :   2 [+0  ]	|
	            10 : 0.010 : 0.955 :   2 [-2  ]	|
	            11 : 0.005 : 0.960 :   1 [+1  ]	|
	            12 : 0.005 : 0.965 :   1 [+0  ]	|
	            13 : 0.005 : 0.970 :   1 [+0  ]	|
	            16 : 0.005 : 0.975 :   1 [-1  ]	|
	            17 : 0.005 : 0.980 :   1 [+0  ]	|
	            18 : 0.010 : 0.990 :   2 [+1  ]	|
	            20 : 0.005 : 0.995 :   1 [+0  ]	|
	         36-37 : 0.005 : 1.000 :   1 [+0  ]	|

:: info: Overall metrics for 'std.code.lines:code' metric
	Average        : 15.9645390071 [-0.815853149771]
	Minimum        : 0 [+0]
	Maximum        : 201 [+6]
	Total          : 4502.0 [+223.0]
	Distribution   : 282 [+27] regions in total (including 0 [+0] suppressed)
	  Metric value : Ratio : R-sum : Number of regions
	           0-1 : 0.053 : 0.053 :  15 [+3  ]	|||||
	             2 : 0.124 : 0.177 :  35 [+9  ]	||||||||||||
	             3 : 0.053 : 0.230 :  15 [-3  ]	|||||
	             4 : 0.060 : 0.291 :  17 [+7  ]	||||||
	             5 : 0.089 : 0.379 :  25 [+7  ]	|||||||||
	             6 : 0.060 : 0.440 :  17 [-1  ]	||||||
	             7 : 0.050 : 0.489 :  14 [-2  ]	|||||
	           8-9 : 0.074 : 0.564 :  21 [+3  ]	|||||||
	            10 : 0.035 : 0.599 :  10 [+5  ]	||||
	            11 : 0.082 : 0.681 :  23 [+4  ]	||||||||
	         12-13 : 0.043 : 0.723 :  12 [-9  ]	||||
	         14-15 : 0.039 : 0.762 :  11 [-1  ]	||||
	         16-18 : 0.028 : 0.791 :   8 [+4  ]	|||
	         19-22 : 0.039 : 0.830 :  11 [+0  ]	||||
	         23-26 : 0.039 : 0.869 :  11 [+2  ]	||||
	         27-32 : 0.028 : 0.897 :   8 [-3  ]	|||
	         38-50 : 0.025 : 0.922 :   7 [+0  ]	||
	         51-69 : 0.025 : 0.947 :   7 [+1  ]	||
	        71-100 : 0.032 : 0.979 :   9 [+2  ]	|||
	       101-201 : 0.021 : 1.000 :   6 [-1  ]	||

:: info: Directory content:
	Directory      : .
Detailed metrics per file/region
The same view tool can print detailed metrics per file and per every region in the specified file. In order to get detailed metrics, enumerate files of interest after '--'. For example:
> python "/path/to/metrix++.py" view --db-file=boost_1_54_0/metrixpp.db --db-file-prev=boost_1_52_0/metrixpp.db -- ./boost/interprocess/detail/managed_open_or_create_impl.hpp
produces output similar to this (truncated to make the page shorter):
./interprocess/detail/managed_open_or_create_impl.hpp:302: info: Metrics per 'priv_open_or_create' region
	Region name    : priv_open_or_create
	Region type    : function
	Offsets        : 8314-14526
	Line numbers   : 301-467
	Modified       : True
	std.code.complexity:cyclomatic: 37 [+1]
	std.code.lines:code: 148 [+4]
More about the viewer
The 'view' command has got an option to alter the output format. It is possible to get the same data in xml or python dictionary formats. This can be particularly useful for integration of the tool with other applications. For example, an editor may re-collect and show context based metrics when a file is saved.
> python "/path/to/metrix++.py" view --db-file=boost_1_54_0/metrixpp.db --format=xml
Check other options of the view tool by executing:
> python "/path/to/metrix++.py" view --help
Apply thresholds
The viewer shows (above) that there are functions with quite large cyclomatic complexities. Growth of this metric can be considered as negative trend. The Metrix++ 'limit' tool offers the capability to manage control over trends by applying limits to metric values. Exceeded limits could be raised as alarms by quality management and control.
Hotspots
The hotspots mode of the limit tool helps to identify top files/regions exceeding a metric threshold. Let's identify the top 3 functions in the boost interprocess library, which exceed a limit of 15 points of cyclomatic complexity:
> python "/path/to/metrix++.py" limit --db-file=boost_1_54_0/metrixpp.db --max-limit=std.code.complexity:cyclomatic:15 --hotspots=3
./interprocess/detail/managed_open_or_create_impl.hpp:302: warning: Metric 'std.code.complexity:cyclomatic' for region 'priv_open_or_create' exceeds the limit.
	Metric name    : std.code.complexity:cyclomatic
	Region name    : priv_open_or_create
	Metric value   : 37
	Modified       : None
	Change trend   : None
	Limit          : 15.0
	Suppressed     : False

./interprocess/streams/vectorstream.hpp:284: warning: Metric 'std.code.complexity:cyclomatic' for region 'seekoff' exceeds the limit.
	Metric name    : std.code.complexity:cyclomatic
	Region name    : seekoff
	Metric value   : 25
	Modified       : None
	Change trend   : None
	Limit          : 15.0
	Suppressed     : False

./interprocess/streams/bufferstream.hpp:174: warning: Metric 'std.code.complexity:cyclomatic' for region 'seekoff' exceeds the limit.
	Metric name    : std.code.complexity:cyclomatic
	Region name    : seekoff
	Metric value   : 23
	Modified       : None
	Change trend   : None
	Limit          : 15.0
	Suppressed     : False
Controlling trends
The exit code of the 'limit' tool is equal to the number of warnings printed. This supports use of the tool as a static analysis tool during the software build process. In this case, a non-zero exit code means that there are violations to the agreed standards and it may fail the build. The same command without --hotspots option will print all regions/files exceeding the specified limit:
> python "/path/to/metrix++.py" limit --db-file=boost_1_54_0/metrixpp.db --max-limit=std.code.complexity:cyclomatic:15
Modes to exclude old code from the considiration
However, it is likely there are many warnings printed in this mode, especially if very old or legacy code is profiled against new metrics and coding rules. Although all warnings can be removed by re-factoring as a big task force activity, it is where many tools are rejected, because it is difficult to justify the initial cost of applying and integrating them. The Metrix++ 'limit' tool has got an option --warn-mode, which helps to overcome this problem.
--warn-mode=touched encourages re-factoring only for new and modified regions. It enables continuous refactoring. It does not matter how late the rule is applied or the coding standard is modified. It is possible to do it anytime with zero initial investment. For example, applying it to the boost interprocess library for a changes between 1.52 and 1.54 versions results in only 6 warnings:
> python "/path/to/metrix++.py" limit --db-file=boost_1_54_0/metrixpp.db --db-file-prev=boost_1_52_0/metrixpp.db --max-limit=std.code.complexity:cyclomatic:15 --warn-mode=touched
./interprocess/detail/managed_open_or_create_impl.hpp:302: warning: Metric 'std.code.complexity:cyclomatic' for region 'priv_open_or_create' exceeds the limit.
	Metric name    : std.code.complexity:cyclomatic
	Region name    : priv_open_or_create
	Metric value   : 37
	Modified       : True
	Change trend   : +1
	Limit          : 15.0
	Suppressed     : False

./interprocess/ipc/message_queue.hpp:375: warning: Metric 'std.code.complexity:cyclomatic' for region 'insert_at' exceeds the limit.
	Metric name    : std.code.complexity:cyclomatic
	Region name    : insert_at
	Metric value   : 16
	Modified       : True
	Change trend   : 0
	Limit          : 15.0
	Suppressed     : False

./interprocess/mapped_region.hpp:575: warning: Metric 'std.code.complexity:cyclomatic' for region 'mapped_region' exceeds the limit.
	Metric name    : std.code.complexity:cyclomatic
	Region name    : mapped_region
	Metric value   : 18
	Modified       : True
	Change trend   : +2
	Limit          : 15.0
	Suppressed     : False

./interprocess/mem_algo/detail/mem_algo_common.hpp:452: warning: Metric 'std.code.complexity:cyclomatic' for region 'priv_allocate_many' exceeds the limit.
	Metric name    : std.code.complexity:cyclomatic
	Region name    : priv_allocate_many
	Metric value   : 20
	Modified       : True
	Change trend   : 0
	Limit          : 15.0
	Suppressed     : False

./interprocess/mem_algo/rbtree_best_fit.hpp:787: warning: Metric 'std.code.complexity:cyclomatic' for region 'priv_expand_both_sides' exceeds the limit.
	Metric name    : std.code.complexity:cyclomatic
	Region name    : priv_expand_both_sides
	Metric value   : 17
	Modified       : True
	Change trend   : 0
	Limit          : 15.0
	Suppressed     : False

./interprocess/sync/windows/named_sync.hpp:98: warning: Metric 'std.code.complexity:cyclomatic' for region 'open_or_create' exceeds the limit.
	Metric name    : std.code.complexity:cyclomatic
	Region name    : open_or_create
	Metric value   : 18
	Modified       : True
	Change trend   : 0
	Limit          : 15.0
	Suppressed     : False
If it is challenging or of little benefit to refactor everything touched, --warn-mode=trends simplifies the control over modified regions and only makes sure that there are no regressions in modified code. In other words, a warning is printed about a modified region/file only if a metric exceeds the specified limit and the value of the metric has got a negative trend due to the modification. It is possible to apply it anytime with zero initial investment and almost zero on-going investment around old code. For example, applying it to the boost interprocess library for a changes between 1.52 and 1.54 versions results in only 2 warnings:
> python "/path/to/metrix++.py" limit --db-file=boost_1_54_0/metrixpp.db --db-file-prev=boost_1_52_0/metrixpp.db --max-limit=std.code.complexity:cyclomatic:15 --warn-mode=trend
./interprocess/detail/managed_open_or_create_impl.hpp:302: warning: Metric 'std.code.complexity:cyclomatic' for region 'priv_open_or_create' exceeds the limit.
	Metric name    : std.code.complexity:cyclomatic
	Region name    : priv_open_or_create
	Metric value   : 37
	Modified       : True
	Change trend   : +1
	Limit          : 15.0
	Suppressed     : False

./interprocess/mapped_region.hpp:575: warning: Metric 'std.code.complexity:cyclomatic' for region 'mapped_region' exceeds the limit.
	Metric name    : std.code.complexity:cyclomatic
	Region name    : mapped_region
	Metric value   : 18
	Modified       : True
	Change trend   : +2
	Limit          : 15.0
	Suppressed     : False
--warn-mode=new ignores existing code and ensures that warnings are only about new code. For example, applying it to the boost interprocess library for a changes between 1.52 and 1.54 versions results in 0 warnings, so it shows that the new code is totally compliant with the standard required in the example.
> python "/path/to/metrix++.py" limit --db-file=boost_1_54_0/metrixpp.db --db-file-prev=boost_1_52_0/metrixpp.db --max-limit=std.code.complexity:cyclomatic:15 --warn-mode=new
Suppressions
It is possible to suppress warnings. Suppressions are collected from comments in code and used by the 'limit' tool to filter out suppressed warnings. It supports fine grained control over false-positive warnings, if there are any.
In order to suppress a warning:
- per region metrics: put the metrix++ instruction in the comments before the region, for example:
// This function returns string typed
// representation of a name of a color,
// requested by color's id
// metrix++: suppress std.code.complexity:cyclomatic
std::string getColorName(int color_id)
{
	switch (color_id)
	{
	case COLOR_RED:
		return std::string("red")
	case COLOR_GREEN:
		return std::string("green")
	case COLOR_BLUE:
		return std::string("blue")
	/* and so on */
	}
}
- per file metrics: put the metrix++ instruction in the comments at the beginning of a file, for example:
//
// This file does processing of colors and brushes
//
// However, it is too long and big file, and there is no time
// to split it into multiple file, so shut up the metrix++ warnings:
// metrix++: suppress std.general:size
//

std::string getColorName(int color_id)
{
	...
...
- activate collection of suppressions:
> python "/path/to/metrix++.py" collect --std.suppress
- run the 'limit' tool WITHOUT --disable-suppressions option:
> python "/path/to/metrix++.py" limit ...
Other applications
Checking data file properties
The Metrix++ 'info' tool is helpful to check the properties of a data file, like the settings used to write it, collected metrics and files processed. For example:
> python "/path/to/metrix++.py" info --db-file=boost_1_54_0/metrixpp.db
	version        : 1.0
	std.code.complexity:version: 1.1
	std.code.cpp:version: 1.1
	std.code.cpp:files: *.c,*.cc,*.cpp,*.cxx,*.h,*.hh,*.hpp,*.hxx
	std.code.cs:version: 1.0
	std.code.cs:files: *.cs
	std.code.java:version: 1.1
	std.code.java:files: *.java
	std.code.lines:version: 1.1

test_workflow.db:: info: Collected metrics:
	std.code.complexity:cyclomatic:
	std.code.lines:code:

:: info: Processed files and checksums:
	./interprocess/allocators/detail/node_pool.hpp: 0xb099a7c3
	./interprocess/allocators/detail/node_tools.hpp: 0xaaf5044d
	./interprocess/anonymous_shared_memory.hpp: 0x2bf06cb0
	./interprocess/containers/allocation_type.hpp: 0x8e95cda0
	./interprocess/containers/containers_fwd.hpp: 0xa4d0d9f7
	./interprocess/containers/deque.hpp: 0x6dbb77af
	./interprocess/containers/flat_map.hpp: 0x6750338c
	...
Exporting results
The Metrix++ 'export' tool exports data files to csv formated files. For example:
> python "/path/to/metrix++.py" export --db-file=boost_1_54_0/metrixpp.db > boost_1_54_0/metrixpp.csv
file,region,type,modified,line start,line end,std.code.complexity:cyclomatic,std.code.lines:code
./interprocess/allocators/detail/node_pool.hpp,__global__,global,,1,110,,0
./interprocess/allocators/detail/node_pool.hpp,boost,namespace,,33,105,,2
./interprocess/allocators/detail/node_pool.hpp,interprocess,namespace,,34,104,,2
./interprocess/allocators/detail/node_pool.hpp,ipcdetail,namespace,,35,103,,4
./interprocess/allocators/detail/node_pool.hpp,SegmentManager,class,,39,72,,16
...
Files with csv format can be opened by applications, like Microsoft Office Excel, with advanced analysis capabilities. For example, to draw this distribution graph:
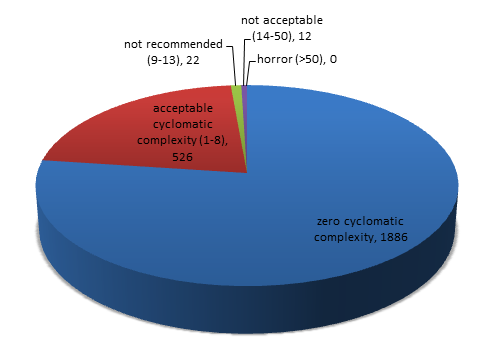
It is not recommended to use the export tool to implement custom post-analysis Metrix++ extensions. The main reason is that granted backward compatibility support for csv columns is not granted. Another main reason is that exporting is relatively slow process. It is recommended to use Metrix++ extensions API instead.
Exporting reports
The Metrix++ 'report' tool can be used to report the current data of all files and metrics which have been collected so far.
> python "/path/to/metrix++.py" report --db-file=boost_1_54_0/metrixpp.db --format=doxygen --output-dir=/path/to/generated/output
This can be used to integrate metrics in automatically generated reports. Currently the 'report' tool can generate data to be integrated in doxygen documentation. The tool creates a 'metrixpp.dox' file in the output directory.
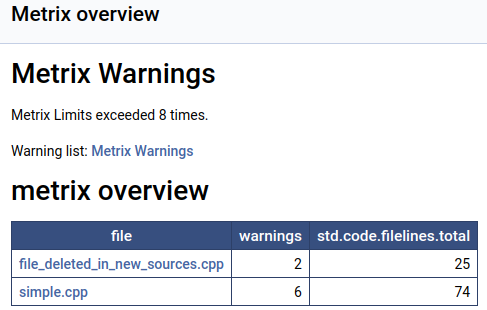
This will create an overview Table as seperate page:
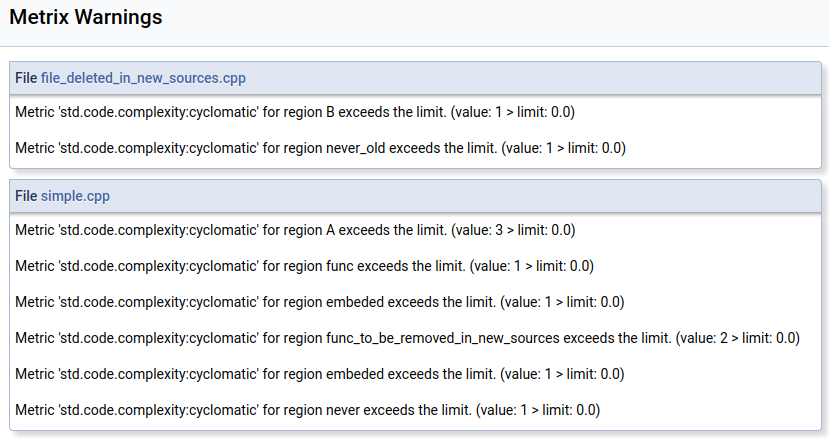
Create a new global list with metrix warnings (analog to the todo list):
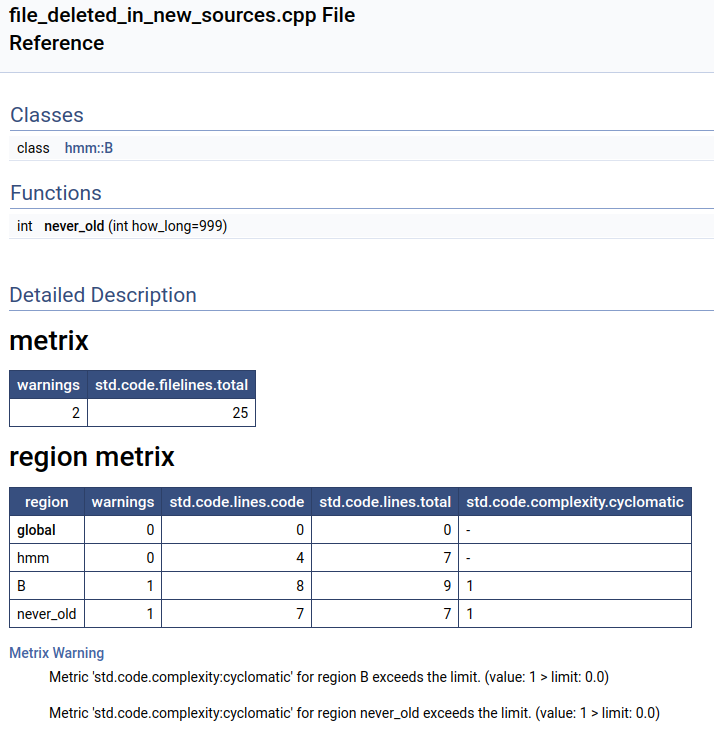
And add a metrix section on top of every files documentation page:
The doxygen format requires pytablewriter to be installed.
> pip install pytablewriter
Besides the doxygen format the report can be used to create simple text 'txt' or json 'json' reports to be integrated in logs or other tools.
If no output directory is given the result is printed to stdout.
The 'report' tool accepts the same options as the limit tool. The violated thresholds are added to the report as warnings.